Fleet API + Power BI: build your dashboard

Use Power BI to pull, shape, and visualize Fleet API data in a few minutes. This guide covers a quick start with a single endpoint, then shows how to loop through paginated endpoints and date-bounded queries like trips.
Replace BASE_URL with the regional hostname for your tenant. See the base URL guide: Fleet API Base URLs.
Generate and manage API credentials with basic auth as described in Fleet API Authentication.
Prerequisites
- Power BI Desktop installed.
- Fleet API credentials with access to the endpoints you plan to query.
- Network access to your Fleet API base URL (BASE_URL).
Quick connect: vehicle status (no pagination)
This endpoint returns the current status for every vehicle and is the fastest way to validate your connection.
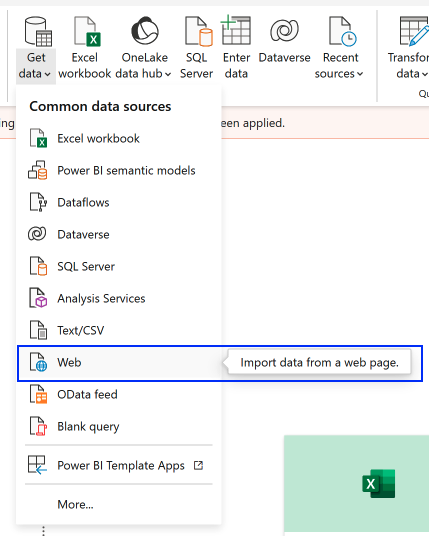
- In Power BI Desktop, choose Get Data → Web.
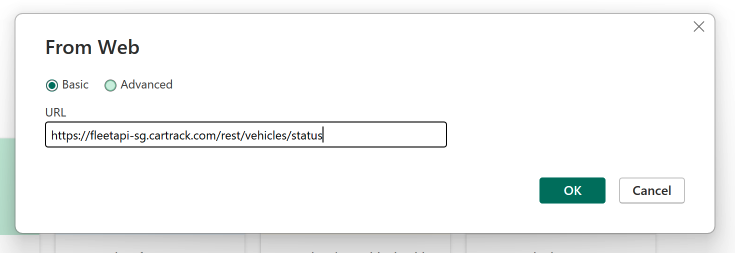
- Enter
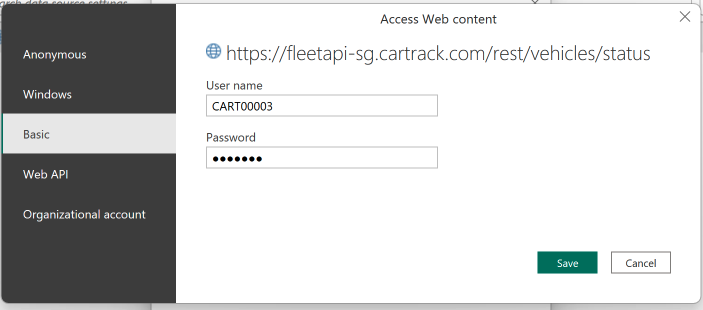
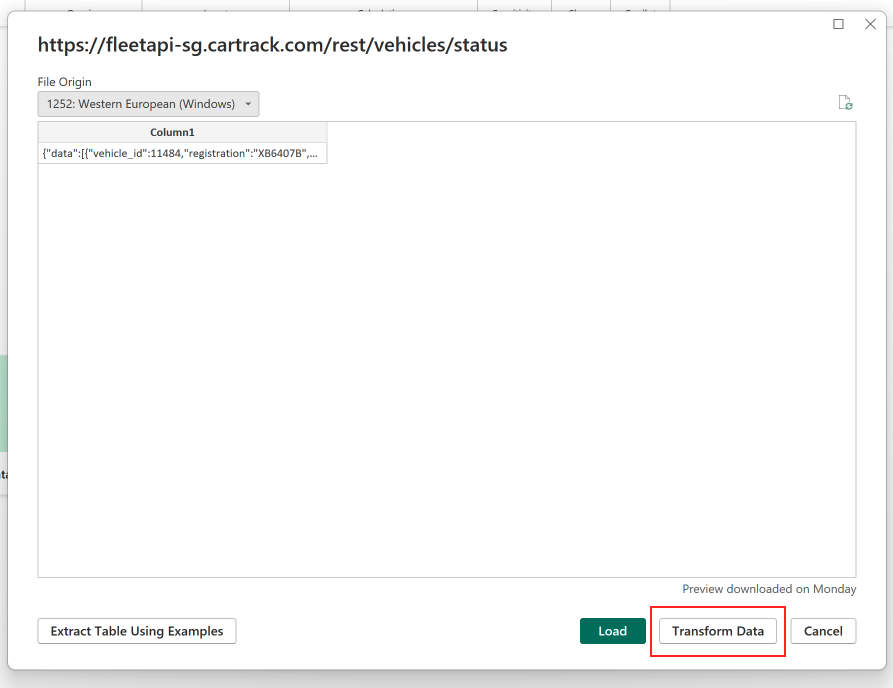
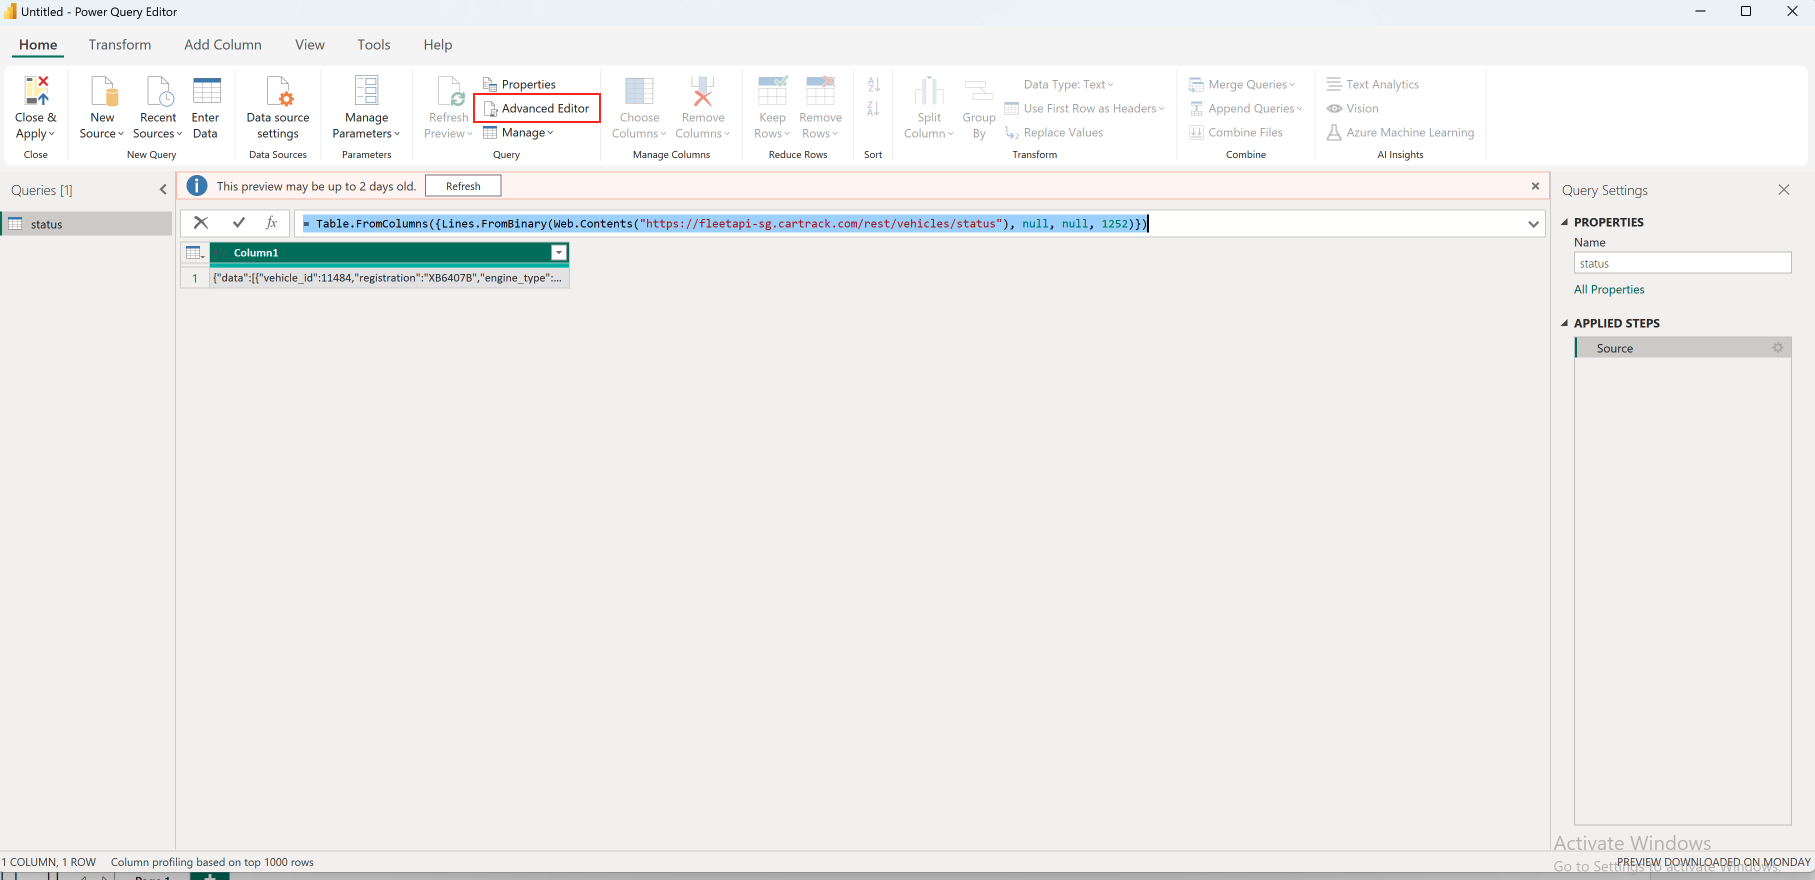
https://BASE_URL/rest/vehicles/statusand select Basic authentication with your API credentials. - Load the data, then open Transform Data → Advanced Editor and replace the query with the snippet below to expand nested fields.
- If you need to rotate or update credentials later, use Power BI Data source settings (see the authentication guide linked above).
Import Data From Web
Input URL
Managing Credentials
After Connecting The Data Source
Transforming The Data
Once you have connected to the Fleet API, you can transform the data to make it more useful for analysis. This section will guide you through using the Power BI Advanced Editor to shape the data into a coherent table.
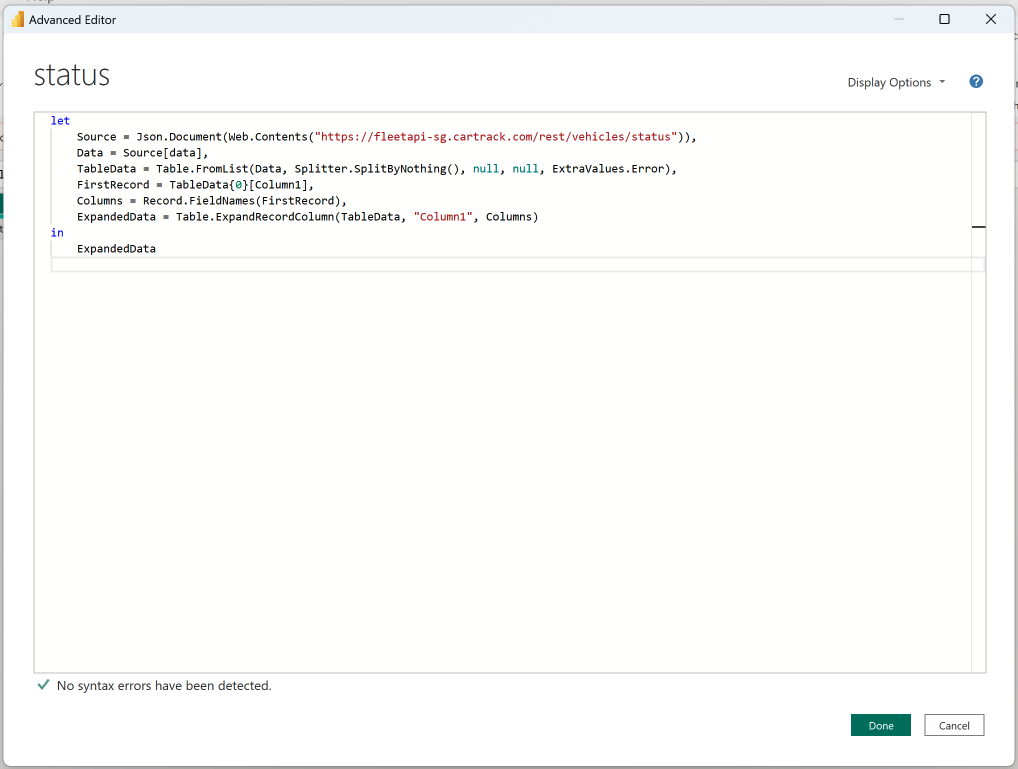
Advanced Editor
In Power BI Desktop, open Transform Data → Advanced Editor, then replace the existing query with:
let
    // Load JSON data from the API
    BaseUrl = "https://BASE_URL",
    Source = Json.Document(
        Web.Contents(BaseUrl,
            [ RelativePath = "rest/vehicles/status" ]
        )
    ),

    // Access the "data" field in the JSON
    Data = Source[data],

    // Convert the list into a table
    TableData = Table.FromList(
        Data,
        Splitter.SplitByNothing(),
        null,
        null,
        ExtraValues.Error
    ),

    // Automatically get column names from the first record
    FirstRecord = TableData{0}[Column1],
    Columns = Record.FieldNames(FirstRecord),

    // Expand top-level JSON properties into columns
    ExpandedData = Table.ExpandRecordColumn(TableData, "Column1", Columns),
    ExpandedWDriver = Table.ExpandRecordColumn(ExpandedData, "driver",
        {"driver_id", "first_name", "last_name", "id_number", "license_number", "driver_id_tag", "phone_number"}),
    ExpandedWFuel = Table.ExpandRecordColumn(ExpandedWDriver, "fuel",
        {"updated", "level", "percentage_left", "total_consumed"}),
    ExpandedWFuelF = Table.RenameColumns(ExpandedWFuel, {{"updated", "updated_fuel_ts"}}),
    ExpandedWElectric = Table.ExpandRecordColumn(ExpandedWFuelF, "electric",
        {"battery_percentage_left", "battery_ts"}),
    ExpandedWLocation = Table.ExpandRecordColumn(ExpandedWElectric, "location",
        {"updated", "longitude", "latitude", "gps_fix_type", "position_description", "geofence_ids"}),
    ExpandedWLocationF = Table.RenameColumns(ExpandedWLocation, {{"updated", "updated_location_ts"}}),

    // Remove timezone offset and convert to datetime
    RemoveTimezone = Table.TransformColumns(ExpandedWLocationF, {
        {"event_ts", each Text.BeforeDelimiter(_, "+"), type text},
        {"updated_fuel_ts", each Text.BeforeDelimiter(_, "+"), type text},
        {"updated_location_ts", each Text.BeforeDelimiter(_, "+"), type text}
    }),
    ConvertToDate = Table.TransformColumns(RemoveTimezone, {
        {"event_ts", each DateTime.FromText(_, "en-US"), type datetime},
        {"updated_fuel_ts", each DateTime.FromText(_, "en-US"), type datetime},
        {"updated_location_ts", each DateTime.FromText(_, "en-US"), type datetime}
    })

in
    ConvertToDate
Paginated endpoints: vehicles and drivers
The /rest/vehicles and /rest/drivers endpoints are paginated. Use two reusable functions: one to fetch the last page, and one to fetch page data.
Helper: fetch last page value
Create a Blank Query named FetchLastPageValue with this code:
(baseUrl as text, relativePath as text, optional start_timestamp as nullable text, optional end_timestamp as nullable text) =>
let
    QueryParams = [
        limit = "1000",
        start_timestamp = if start_timestamp <> null then start_timestamp else "",
        end_timestamp = if end_timestamp <> null then end_timestamp else ""
    ],
    FirstPage = Json.Document(Web.Contents(baseUrl, [ RelativePath = relativePath, Query = QueryParams ])),
    LastPage = FirstPage[meta][last_page]
in
    LastPage
Helper: fetch a page
Create a Blank Query named FetchPage with this code:
(baseURL as text, relativePath as text, page as number, optional start_timestamp as text, optional end_timestamp as text) =>
let
    PageData = Json.Document(
        Web.Contents(baseURL,
            [ RelativePath = relativePath,
              Query = [ limit = "1000", page = Text.From(page), start_timestamp = if start_timestamp <> null then start_timestamp else "", end_timestamp = if end_timestamp <> null then end_timestamp else "" ]
            ])
    ),
    Data = PageData[data]
in
    Data
Vehicles query
Create another Blank Query named vehicles:
let
    BaseUrl = "https://BASE_URL",
    LastPage = FetchLastPageValue(BaseUrl, "rest/vehicles"),
    PageNumbers = List.Numbers(1, LastPage),
    AllData = List.Transform(PageNumbers, each FetchPage(BaseUrl, "rest/vehicles", _)),
    CombinedTable = Table.FromList(List.Combine(AllData), Splitter.SplitByNothing(), null, null, ExtraValues.Error),
    FirstRecord = if Table.RowCount(CombinedTable) > 0 then CombinedTable{0}[Column1] else null,
    Columns = if FirstRecord <> null then Record.FieldNames(FirstRecord) else {},
    ExpandedData = if FirstRecord <> null then Table.ExpandRecordColumn(CombinedTable, "Column1", Columns) else CombinedTable,
    ExpandedWSensors = Table.ExpandRecordColumn(ExpandedData, "sensors", {"electric_battery", "electric_charging", "fuel_analog_level", "fuel_canbus_consumed", "fuel_canbus_level"}),
    ExpandedWCustomF = Table.ExpandRecordColumn(ExpandedWSensors, "custom_fields", {"custom_1", "custom_2", "custom_3", "custom_4", "custom_5", "custom_6", "custom_7", "custom_8"})
in
    ExpandedWCustomF
Drivers query
Create another Blank Query named drivers:
let
    BaseUrl = "https://BASE_URL",
    LastPage = FetchLastPageValue(BaseUrl, "rest/drivers"),
    PageNumbers = List.Numbers(1, LastPage),
    AllData = List.Transform(PageNumbers, each FetchPage(BaseUrl, "rest/drivers", _)),
    CombinedTable = Table.FromList(List.Combine(AllData), Splitter.SplitByNothing(), null, null, ExtraValues.Error),
    FirstRecord = if Table.RowCount(CombinedTable) > 0 then CombinedTable{0}[Column1] else null,
    Columns = if FirstRecord <> null then Record.FieldNames(FirstRecord) else {},
    ExpandedData = if FirstRecord <> null then Table.ExpandRecordColumn(CombinedTable, "Column1", Columns) else CombinedTable,
    ExpandedWCustomF = Table.ExpandRecordColumn(ExpandedData, "custom_fields", {"custom_1", "custom_2", "custom_3", "custom_4", "custom_5", "custom_6", "custom_7", "custom_8"})
in
    ExpandedWCustomF
Paginated + date-bounded: trips
Trips support up to 24 hours per call. Loop through the last 7 days (adjust as needed), fetch all pages for each day, and combine.
let
    BaseUrl = "https://BASE_URL",

    // Date window (last 7 days)
    StartDate = Date.AddDays(Date.From(DateTime.LocalNow()), -7),
    EndDate = Date.From(DateTime.LocalNow()),
    DateList = List.Dates(StartDate, Number.From(EndDate - StartDate) + 1, #duration(1, 0, 0, 0)),
    DateTable = Table.FromList(DateList, Splitter.SplitByNothing(), null, null, ExtraValues.Error),
    DateTableWithTimestamps = Table.AddColumn(DateTable, "start_timestamp", each DateTime.ToText(DateTime.From([Column1]), "yyyy-MM-dd") & " 00:00:00"),
    DateTableWithEnd = Table.AddColumn(DateTableWithTimestamps, "end_timestamp", each DateTime.ToText(DateTime.From([Column1]), "yyyy-MM-dd") & " 23:59:59"),

    // Fetch all pages for a given day
    FetchDataForDate = (start_timestamp as text, end_timestamp as text) =>
        let
            LastPage = FetchLastPageValue(BaseUrl, "rest/trips", start_timestamp, end_timestamp),
            PageNumbers = List.Numbers(1, LastPage),
            AllData = List.Transform(PageNumbers, each FetchPage(BaseUrl, "rest/trips", _, start_timestamp, end_timestamp)),
            CombinedTable = Table.FromList(List.Combine(AllData), Splitter.SplitByNothing(), null, null, ExtraValues.Error),
            FirstRecord = if Table.RowCount(CombinedTable) > 0 then CombinedTable{0}[Column1] else null,
            Columns = if FirstRecord <> null then Record.FieldNames(FirstRecord) else {},
            ExpandedData = if FirstRecord <> null then Table.ExpandRecordColumn(CombinedTable, "Column1", Columns) else CombinedTable
        in
            ExpandedData,

    AllDatesData = List.Transform(Table.ToRecords(DateTableWithEnd), each FetchDataForDate(_[start_timestamp], _[end_timestamp])),
    FinalTableWRecords = Table.Combine(AllDatesData),
    FinalTableWSC = Table.ExpandRecordColumn(FinalTableWRecords, "start_coordinates", {"latitude", "longitude"}),
    FinalTableFinal = Table.RenameColumns(FinalTableWSC, {{"latitude", "start_latitude"}, {"longitude", "start_longitude"}}),
    FinalTableWEC = Table.ExpandRecordColumn(FinalTableFinal, "end_coordinates", {"latitude", "longitude"}),
    FinalTable = Table.RenameColumns(FinalTableWEC, {{"latitude", "end_latitude"}, {"longitude", "end_longitude"}}),

    RemoveTimeZone = Table.TransformColumns(FinalTable, {
        {"start_timestamp", each Text.BeforeDelimiter(_, "+"), type text},
        {"end_timestamp", each Text.BeforeDelimiter(_, "+"), type text}
    }),
    ConvertToDateTime = Table.TransformColumns(RemoveTimeZone, {
        {"start_timestamp", each DateTime.FromText(_, "en-US"), type datetime},
        {"end_timestamp", each DateTime.FromText(_, "en-US"), type datetime}
    })

in
    ConvertToDateTime
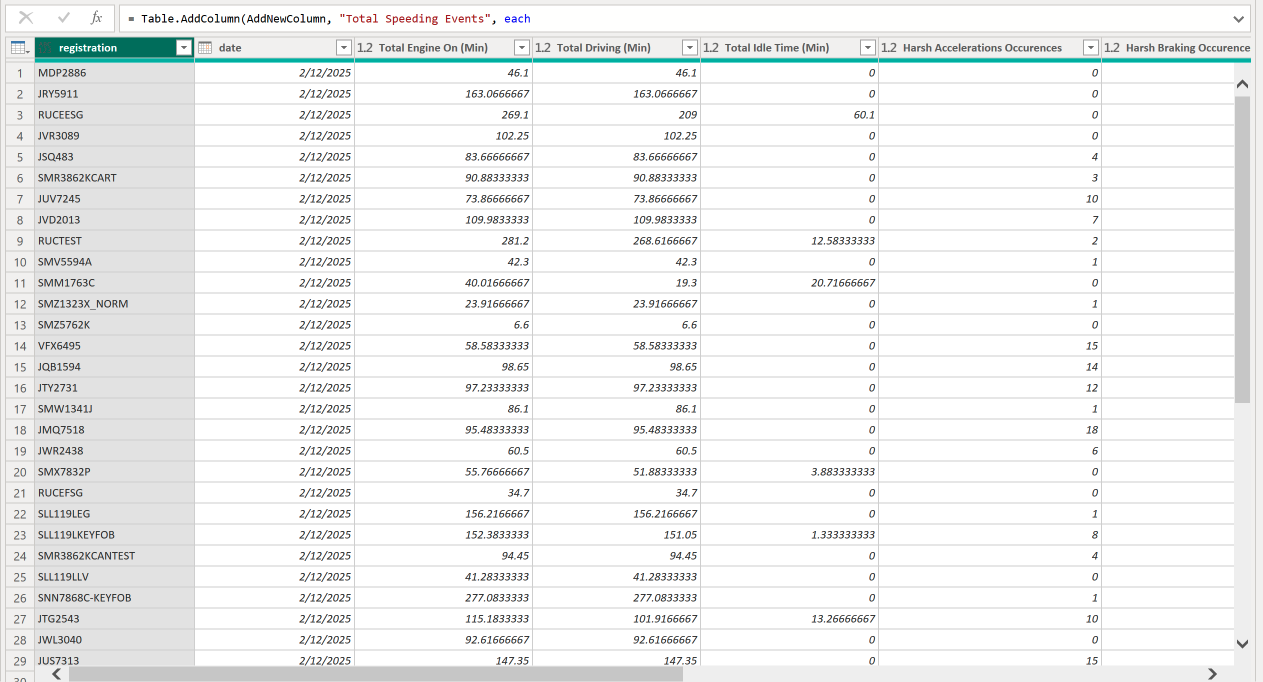
Summarize trips for dashboards
An example aggregation that summarizes trip duration, idling, and harsh events by vehicle and day:
let
    Source = trips,
    AddDateColumn = Table.AddColumn(Source, "date", each Date.From([start_timestamp]), type date),
    GroupedData = Table.Group(AddDateColumn, {"registration", "date"},
        {
            {"Total Engine On (Min)", each List.Sum([trip_duration_seconds]) / 60, type number},
            {"Total Driving (Min)", each (List.Sum([trip_duration_seconds]) - List.Sum([idle_time_seconds])) / 60, type number},
            {"Total Idle Time (Min)", each List.Sum([idle_time_seconds]) / 60, type number},
            {"Harsh Accelerations Occurrences", each List.Sum([harsh_acceleration_events]), type number},
            {"Harsh Braking Occurrences", each List.Sum([harsh_braking_events]), type number},
            {"Harsh Cornering Occurrences", each List.Sum([harsh_cornering_events]), type number},
            {"Thresh. Speeding Occurrences", each List.Sum([thresholds_speeding_events]), type number},
            {"Road Speeding Occurrences", each List.Sum([road_speeding_events]), type number}
        }),
    FilteredRows = Table.SelectRows(GroupedData, each (["Total Engine On (Min)"] <> 0)),
    AddNewColumn = Table.AddColumn(FilteredRows, "Total Harsh Events", each ["Harsh Accelerations Occurrences"] + ["Harsh Braking Occurrences"] + ["Harsh Cornering Occurrences"], type number),
    AddNewColumn2 = Table.AddColumn(AddNewColumn, "Total Speeding Events", each ["Thresh. Speeding Occurrences"] + ["Road Speeding Occurrences"], type number)
in
    AddNewColumn2
Reviewing and end result
- Once the first source is connected, confirm the raw table renders correctly in Power Query (see screenshot above).
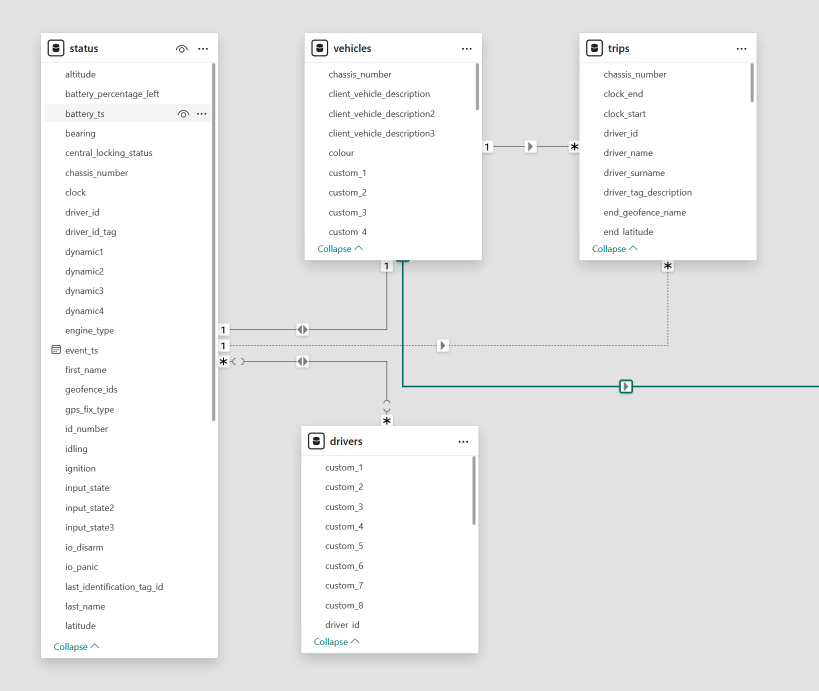
- After applying the transformations, check the populated tables in the model:
- Example daily activity summary:
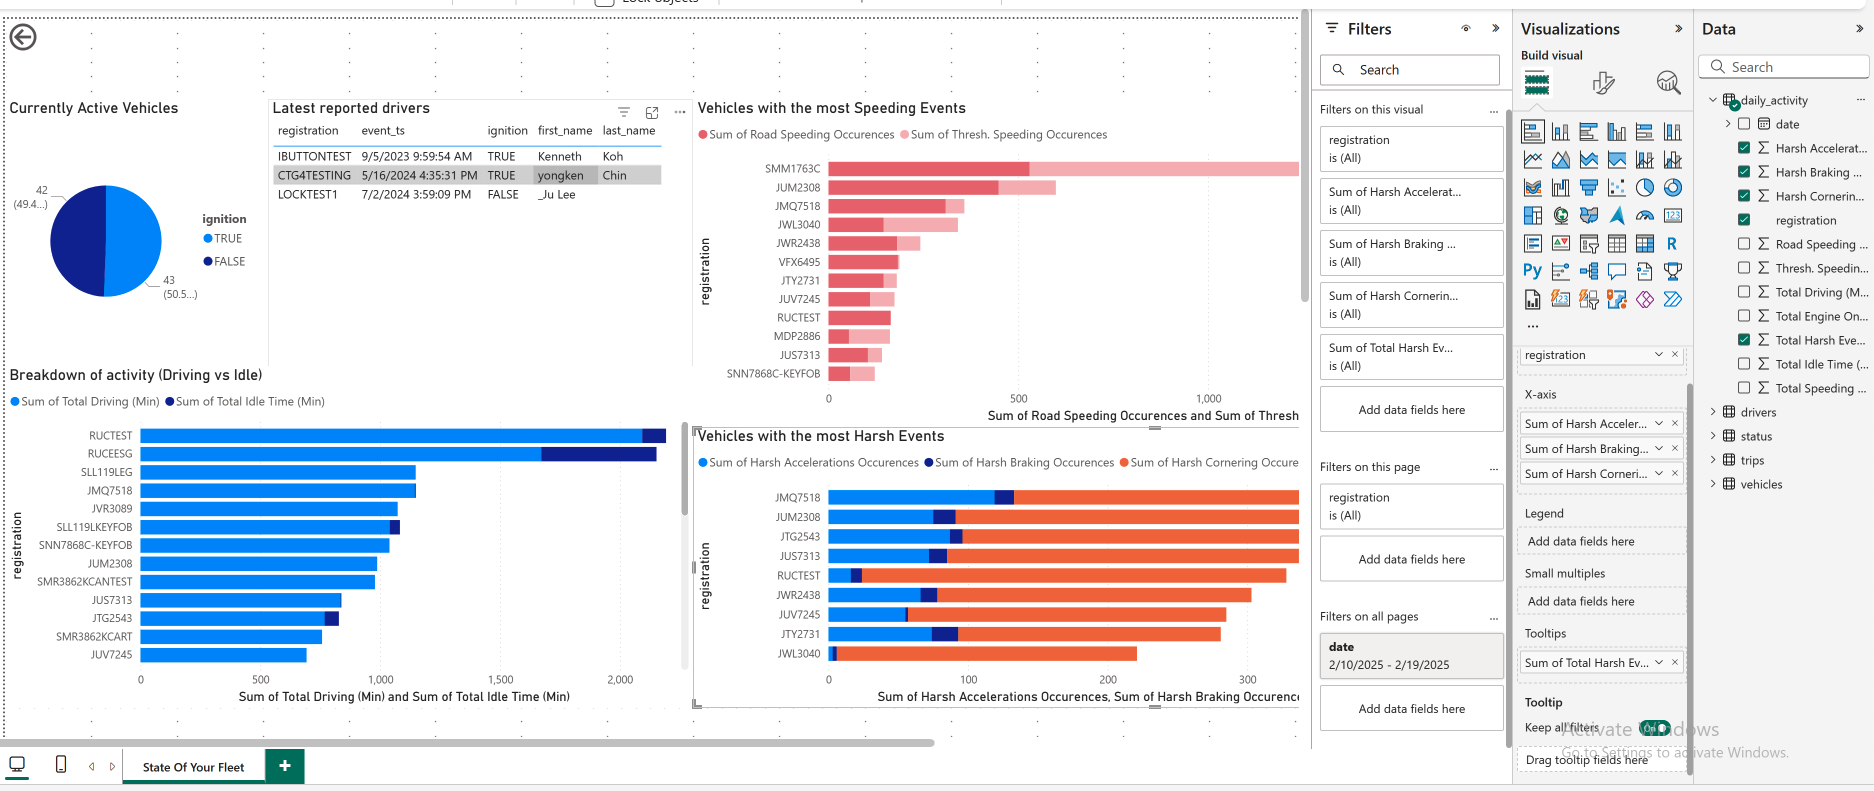
- A finished dashboard might look like:
Disclaimer
Longer lookback windows can take time. If you use Power BI Premium, configure incremental refresh so subsequent refreshes only pull new data instead of reloading the full range.
Feedback
Have suggestions? Email fleet-api@cartrack.com. We read every message. For account-specific or urgent issues, please contact your account manager.